Hardware Debugging, Reversing & Fuzzing
This section discusses the chip debugging terms and reverse engineering in hwdbg.
Software Debugging Components
In software debugging, a native debugger should come with at least 4 main components:
- Reading/writing memory
- Inspecting/modifying registers values
- Stepping through instructions
- Putting breakpoints and pausing the debuggee
Now, each of the above-mentioned components is discussed in detail based on their equivalent actions in hardware systems.
Logic Analyzer (Reading/Writing Memory)
hwdbg can be used as a logic analyzer. This debugger is able to use a configurable number of BlockRAMs to store (write) the value of signals in different timing stages. These signals can then be retrieved (read) by the PS and further illustrated in the form of digital waves.
Signal Inspection and Modification (Inspecting/Modifying Registers Values)
The equivalent of registers in the hwdbg are signals (wires). These input signals can be inspected and further modified using custom scripts.
Emulation of Instruction Stepping by Controlling Clock Signal (Stepping Through Instructions)
If the clock signal is also available to hwdbg, it is possible to control the clock signal passed to the module (IP core) and emulate a behavior similar to the instructions stepping in software debugging. For example, the hardware engineer can pause the signals passed to the chip (including the clock signal) and inspect the values. In the next step, he/she is able to inspect the signal values and modify the pin/port values if needed. Once the inspection/modification is done, one step or one clock rising-edge can be provided to the debuggee chip causing it to further execute the next stage and then avoid producing the next clock cycle.
These manipulation (stopping/running) clock signals are considered as the similar approach in software debugging as for stepping through instruction. Note that, it is not possible to step through the signals in chips where the clock signal is internally produced. This stepping mechanism only applies to those chips that are using external (debugger-controlled) clock signals.
Cutting The Signals Based on Conditions (Putting Breakpoints and Pausing The Debuggee)
As the emulation of putting breakpoints in software debugging, hwdbg comes with the ability to evaluate conditions and trigger events when the conditions are met. The script engine evaluation core is responsible for comparing and evaluating conditions (using if statements) and when the conditions are satisfied, different functions can be used to further pause the execution (pause passing the clock signal to the chip) or produce user configured input instead of the real signal values.
Using these components and facilities, a hardware engineer or a security researcher can investigate chips and IP cores and analyze them effectively.
Anomaly Definition
When it comes to testing and fuzzing chips, it is important to have a common definition of anomaly, as fuzzing involves searching for anomalies in software or hardware. An anomaly is the occurrence of an unexpected state that the designer did not anticipate. Once an anomaly is detected, hwdbg can determine the appropriate subsequent action. Previously, researchers introduced a definition of anomalies that can occur within chips for white-box (RTL source code is available) fuzzing. Since hwdbg mainly operates on black-box (closed source) chips, the same anomaly concepts could not be used, hence we have categorized hardware anomalies into two subsections, each described below.
Anomalies In Expected Functionalities
These anomalies occur when the device malfunctions in response to specific inputs. For instance, the chip or IP core may fail to compute the correct output. These anomalies can be detected when the user knows the target chip well enough to emulate or predict the correct output based on the given inputs, using software that mimics the chip's behavior.
% ## Anomalies Based On Output Signal State
% These anomalies are detected based on the state of output signals. For example, detection mechanisms can identify if a signal goes to an 'X' (unknown), 'U' (uninitialized), or 'Z' (high-impedance) state, which could indicate a fault or unexpected behavior in the chip.
Anomalies Based On Sensors Indications
Sensors can detect possible anomalies or changes in chip coverage due to modifications in the chip's state. Abnormal changes in sensors can indicate an anomaly. For example, a significant state change in a ring oscillator (RO) within a module, even if not reflected in the output, could signal an internal anomaly in the chip.
Automated Fuzzing
Automated fuzzing involves the automated generation and injection of a large volume of random or semi-random inputs into a system to identify vulnerabilities, unexpected behaviors, or crashes. In the context of hardware debugging, automated fuzzing is used to systematically and thoroughly test chips or IP cores to uncover hidden bugs and security flaws. Tools for automated fuzzing generate diverse test cases that can trigger rare corner cases or faults. By continuously running these tests and monitoring the system's response, developers and security researchers can identify and find weaknesses in the design. hwdbg can leverage automated fuzzing to enhance the reliability and security of black-box chips by finding and addressing issues before mass production.
Fault Injection
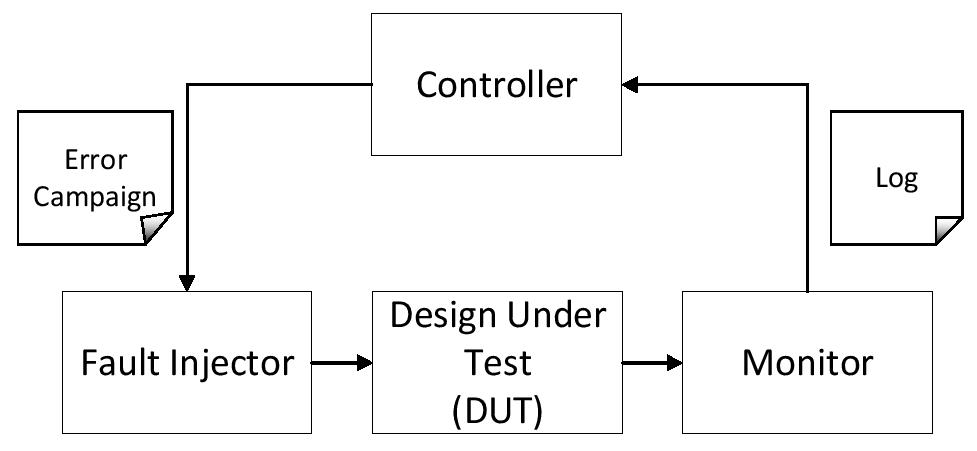
Fault injection is a technique used to test the robustness and reliability of hardware by injecting faults into the system. This method helps in understanding how a system behaves under error conditions and in validating the effectiveness of fault tolerance mechanisms. There are various methods of fault injection, including physical, logical, and software-based techniques. hwdbg can use fault injection to simulate a wide range of fault conditions, thereby ensuring that the system can handle real-world scenarios and recover gracefully from faults. The below figure illustrates the basic components of an error injection environment.
Cut The Signal
Cutting the signal involves intentionally breaking the continuity of a signal path (e.g., the clock signal) within the hardware. This can be used to simulate open-circuit faults or to test the system's response to sudden loss of input. By inserting a fault that temporarily or permanently disconnects a signal line, hardware engineers and security researchers can observe how the hardware reacts, whether it can detect the disconnection, and whether it can continue to operate correctly or not. This method is particularly useful in testing the robustness of communication links and critical signal paths in the design.
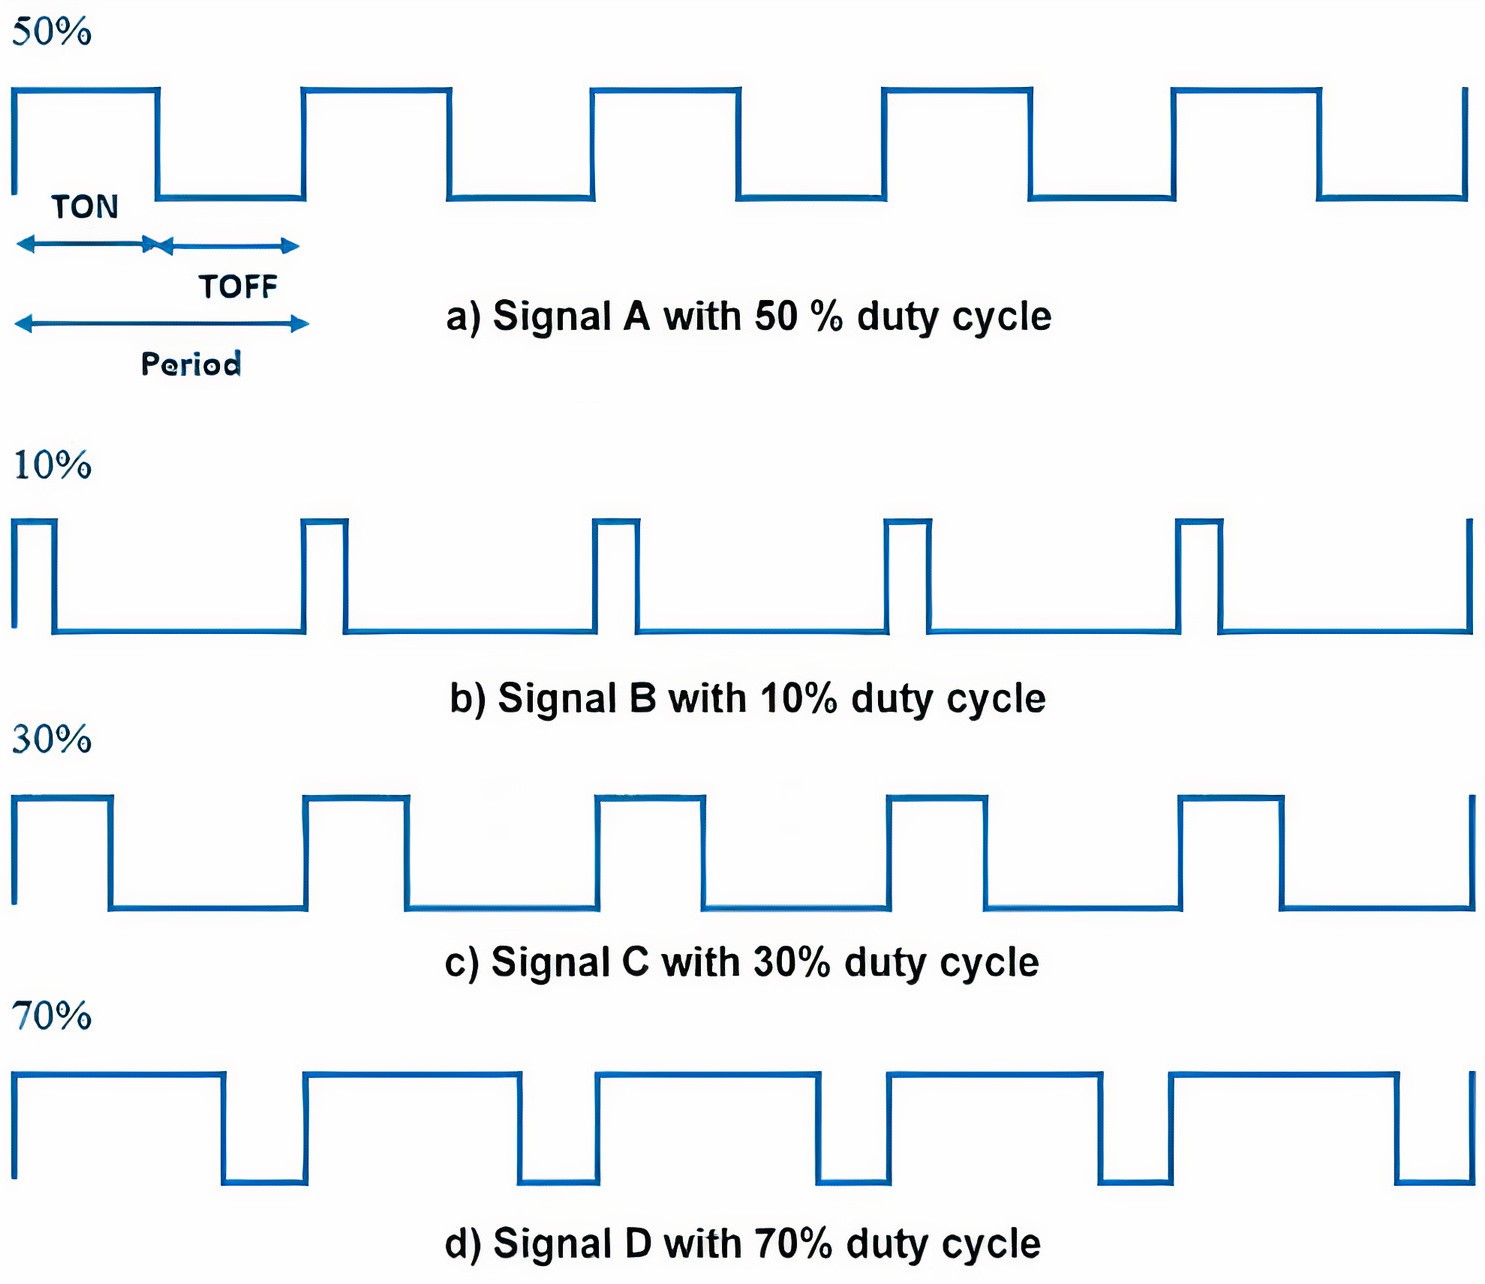
Changing Clock Domain Using PWM
Changing the clock domain using Pulse Width Modulation (PWM) involves altering the clock signal supplied to a part of the circuit. PWM can vary the duty cycle of the clock signal, effectively modifying the clock frequency and simulating various timing scenarios. This technique can be used to test the behavior of the hardware under different clock conditions, such as overclocking, underclocking, and clock glitches. By using PWM to change the clock domain, hwdbg can test the timing resilience of the system, ensure that it operates correctly across a range of clock frequencies, and identify any timing-related faults or vulnerabilities. The following figure demonstrates PWM signals with 50%, 10%, 30%, and 70% duty cycles.